Introduction:
Fitbit offers different types of wearable devices. These wearable devices are very famous for their activity trackers. These devices monitor your physical fitness and health. They monitor your rate too and make a graph of it. Are you using a Fitbit device to track your overall fitness?. If yes, then you would have come across the heart rate graph in your Fitbit app.
The Fitbit heart rate graph shows valuable information about the rate of your heart throughout the day. This thing helps you to monitor your heart condition, health and activity levels. Don’t you know what a normal Fitbit heart rate graph looks like?. You need not to worry. In this article, I will be telling you in detail what a typical Fitbit heart rate graph looks like. I will also be giving you information about what the different patterns mean. Then what are you waiting for?. Let’s begin the show!.

Understanding Fitbit Heart Rate Graphs:
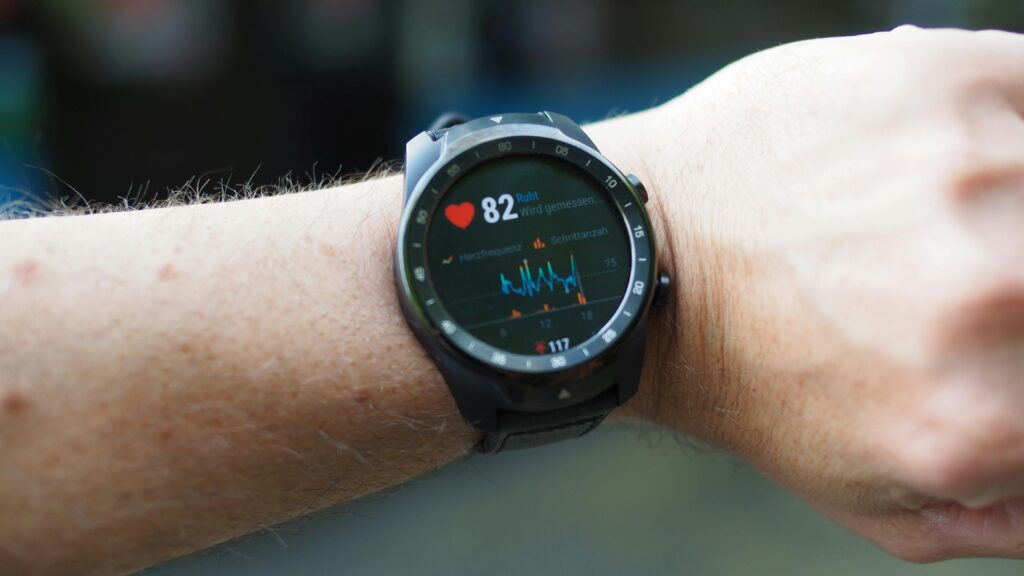
Fitbit devices have optical heart rate sensors in them. They use these sensors to measure your pulse rate throughout the day. They also detect changes in your blood volume as your heart beats. This thing allow Fitbit to track your heart rate both when you are exercising and resting. They display this data in the form of a heart rate graph then. This graph shows your heart rate trends over time.
A normal Fitbit heart rate graph usually has several peaks and valleys. These peaks and valleys represent changes in your heart rate while doing different activities. You will have higher heart rates when you are doing any activity. And you will have lower heart rates when you are at rest or sleeping.

Key Sections of a Fitbit Heart Rate Graph:
Do you want to better understand what your normal heart rate graph looks like?. If yes, then it is important for you to break it down into its key parts. The key sections of a Fitbit heart rate graph are listed below:
Resting Heart Rate (RHR):
This is the rate of your heart when you are at complete rest or sleeping. For the majority of people, a normal resting heart rate is going to be between 60 to 100 heart beats per minute (bpm). Your resting heart rate will be lower in the mornings and during sleep. And it will appear in the form of flat lines on the Fitbit heart rate graph.
Active Heart Rate:
This is the graph of your heart when you are doing physical activities. These activities include walking, running or working out. When you are doing these activities, then your heart rate increases. You will see this thing in the form of peaks on your Fitbit heart rate graph. The intensity of the peaks depends on the intensity of the activities you are doing.
Fat Burn, Cardio, and Peak Zones:
Fitbit has different categories for your heart rate. These different categories are called the Fitbit’s heart rate zones. These zones are based on the intensity of the activities you are performing. These zones include the Fat Burn Zone (50-69% of your max heart rate), Cardio Zone (70-84%), and Peak Zone (85% or higher). Your Fitbit heart rate graph may show different colors for each zone. These colors will help you in visualizing the time you spend in each of these activities.

What a Normal Fitbit Heart Rate Graph Looks Like:
A normal heart rate graph can vary. This thing actually depends on your level of fitness, your daily activities and your overall health. However, there are some typical patterns of the Fitbit heart rate graph. Some of these patterns include:
Resting Periods:
If you are sleeping or inactive, then your Fitbit graph will show lower heart rates. Your heart rate graph will have a little fluctuation. And it will be creating a steady and flat line.
Activity Spikes:
Throughout the day, you will have several spikes in your heart rate. These spikes will occur when you engage in activities like walking, exercising or even climbing stairs. These peaks will vary in height. It is because the height of these peaks are dependent on the intensity of your activities.
Recovery:
After you are done with an activity, then your heart rate will gradually decrease. And it will be back to your normal resting rate. You will see this decline as a downward slope on your Fitbit heart rate graph.

Examples of Different Heart Rate Graphs:
If you want to have a better idea of what your Fitbit heart rate graph might look like, then here are some examples below. These examples will help you in enhancing your understanding of the graph.
Sedentary Day:
If you have spent a sedentary day with little or no physical activity. Then your heart rate graph will consist of long stretches of low and steady heart rates. It will also have a few small spikes if you move around for a short time.
Active Day:
On an active day, you will have more significant spikes in your graph. These spikes will be due to your jogging or doing a workout. And they will be indicating the periods of your high-intensity activity. You will also see a more frequent shift between your resting and active heart rates.
Sleep:
If you see your Fitbit heart rate graph during sleeping, then it will be steady. It will have lower and more consistent beats with fewer fluctuations. Fitbit will also provide you with a sleep score. This score will show how well you slept. Fitbit shows that data based on your heart rate and movements throughout the night.

Using Your Fitbit Heart Rate Graph for Health Insights:
Now you know what a normal Fitbit heart rate graph looks like. You also know how you can use this information to improve your overall health?. Here are some suggestions that will help you to make the most of your Fitbit heart rate data:
Monitor Your Resting Heart Rate:
You can keep a track of your resting heart rate. And it will provide valuable insights into your cardiovascular health. If you have a lower resting heart rate, then it indicates you have a higher level of fitness. If you have sudden changes in your resting heart rate, then it might signal health issues. So it is very good to monitor your heart rate every day by using your Fitbit device.
Check Your Active Heart Rate:
When you are exercising, then you can pay attention to how your heart rate responds. It also enables you to know that you are spending enough time in your cardio or peak zones. This thing can help you in gauging the effectiveness of your workouts?. It also makes sure that you are working out with the right intensity. And there is nothing wrong with it.
Track Recovery:
You can study in your Fitbit heart rate graph how much time your heart takes to recover to normal after an intense activity. If your heart rate is taking longer to recover, then you might need to adjust your training or rest more.
Analyze Sleep Patterns:
Your Fitbit heart rate graph while sleeping can help you in understanding of your sleep quality. Fitbit tracks your heart rate variability. This thing is linked to your sleep stages (light, deep and REM sleep). Consistently poor sleep can be noticed in your heart rate graph. So you can make changes in your sleep habits. And solve this issue easily.

Conclusion:
Fitbit devices are very useful for having a track of your health and fitness. They have many amazing features. One of the best among them is the Fitbit heart rate graph. This graph shows your heart rate throughout the day. Your normal heart rate will consist of periods of lower rates during rest and higher rates during activity. You should understand these patterns. And they will help you in monitoring your fitness, tracking recovery and any potential health concerns. You should keep an eye on your Fitbit heart rate graph. And adjust your activities as per it to have a stronger and healthier heart.

FAQS:
Q: What are Fitbit devices?.
Ans: Fitbit devices are wearable devices that track your activities. They also monitor your physical fitness and health.
Q: What does a normal Fitbit heart rate graph look like when you are at rest?.
Ans: A normal Fitbit heart rate graph when you are resting will show lower heart rates with little fluctuations.
Q: What is the maximum heart rate in the Fat Burn zone?.
Ans: The maximum heart rate in the Fat Burn zone is 50-69%.
Q: How many Key Sections a Fitbit Heart Rate Graph has?.
Ans: A Fitbit Heart Rate Graph has three sections:
- Resting Heart Rate
- Active Heart Rate
- Intense Activities Heart Rate


